Home / Analytics

Measure What Matters With RenderEase Analytics

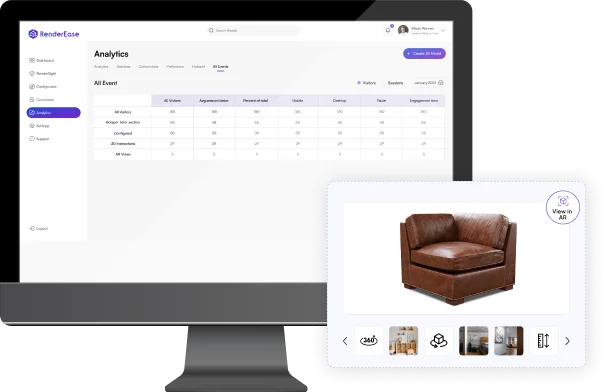
Unlock valuable insights with RenderEase Analytics- track your most popular products, analyze configurations, and uncover bestsellers. Get the critical data to understand and meet your customers’ preferences effortlessly.

Turn data into Knowledge and Visitors into customers!

Understand Customer Journey

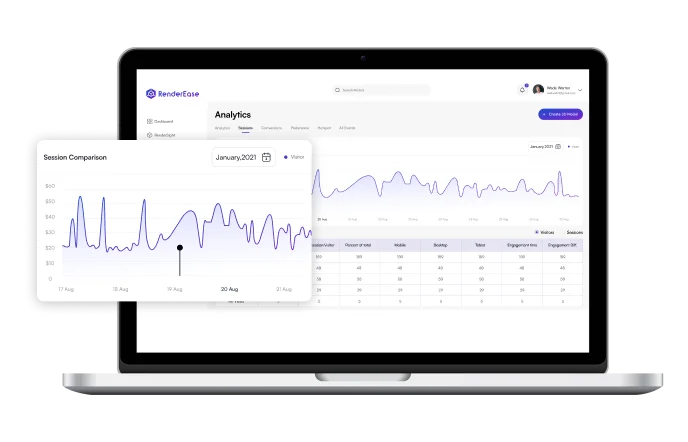
Gain insights into how your customers interact with your 3D models. Learn how often they viewed, interacted, and engaged with your model. 

Fuel your performance

Woo your customers with lightning-fast load times and minimal error rates, ensuring a flawless and immersive user experience. These key performance metrics fuel enhanced performance and deeper user engagement.

Bolster Customer Insights

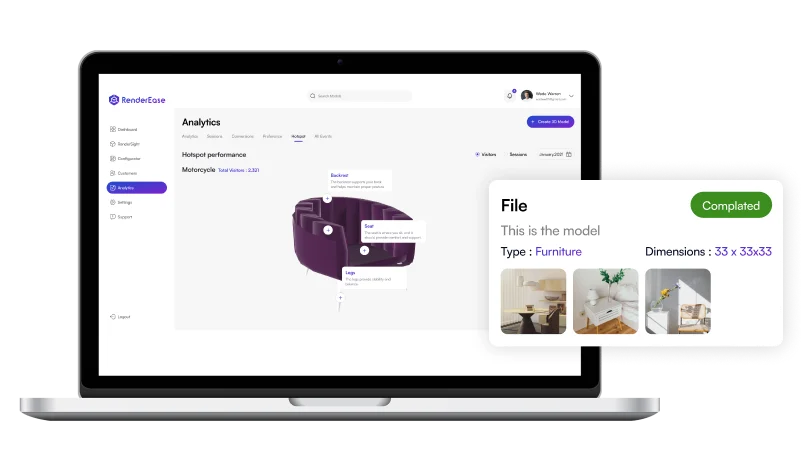
Harness behavioral analytics to boost sales! Heat Maps reveal user and hotspot interaction, while Path Analysis tracks the journey from viewing 3D models to purchase behavior and everything in between. Thoroughly understand your customers and optimize their buying experience for maximum impact!

Empower Customers

Aspire for excellence with ratings and reviews of 3D/AR experiences. Measure loyalty with Net Promoter Score (NPS) to enhance customer engagement and drive recommendations.

Powerful Purchase Predictions

Leverage machine learning to predict purchase likelihood based on user interactions with 3D models. Identify emerging trends and popular products through Trend Analysis, enabling informed decisions and boosting sales

Amplify with Sales Analytics

Measure revenue impact and compare product performance with Sales Analytics. Discover how 3D/AR models enhance sales and identify top-performing products to drive growth and profitability.

Measure Success with RenderEase Analytics 

Fuel your marketing strategy.

Use in-depth insights to refine marketing campaigns and optimize visual merchandising, ensuring your products not only capture attention but also drive substantial revenue growth.

Enhance the customer journey

Gain a customer’s perspective and measure the impact of 3D experiences to elevate their journey with your products. Use these insights to tailor offerings, creating seamless, engaging interactions that boost satisfaction and foster lasting customer relationships.

Predict purchase intent.

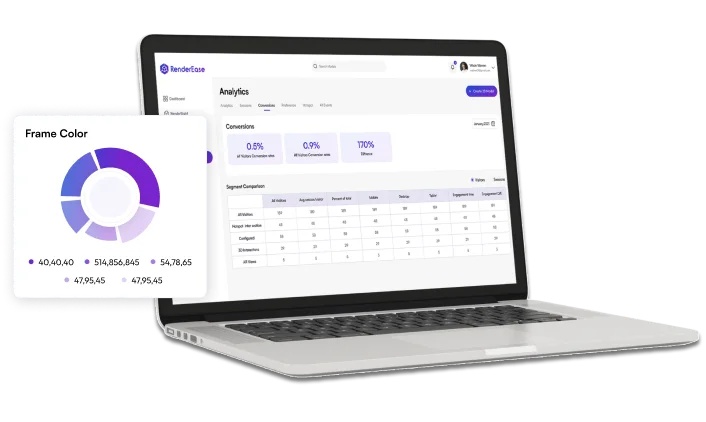
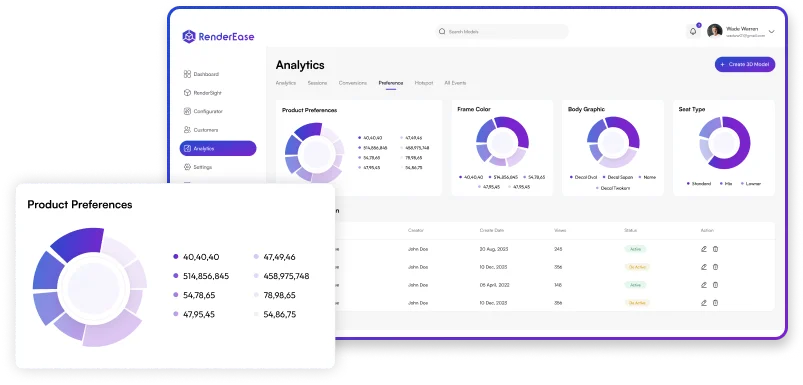
Stay ahead by discovering popular products and configurations. Our predictive analytics enable a proactive digital merchandising strategy, aligning your offerings precisely with customer preferences, maximizing sales potential, and maintaining a competitive edge.

Get a taste of RenderEase's Freemium

✔️ It costs absolutely nothing!

Get a taste of RenderEase, join our early adopter program today!

FAQs for
Analytics

  • 3D and AR analytics provide insights into how customers interact with 3D models and AR experiences, revealing which features drive engagement and conversions.
  • By understanding these interactions, you can optimise your product presentations, refine your sales strategies, and ultimately increase conversion rates and sales.
  • For example, businesses using AR have reported a 94% increase in conversion rates (source: Shopify).

Key metrics to track include:

  • Interaction Metrics: Frequency and duration of user interactions with 3D models.
  • Engagement Metrics: Clicks, likes, shares, etc.
  • Conversion Rates: Comparison of sales performance for products with and without 3D/AR features.
  • Customer Feedback: Satisfaction scores and Net Promoter Scores (NPS).
  • Performance Metrics: Load times and error rates during interactions with 3D models.
  • To integrate 3D and AR analytics into your existing e-commerce platform, use the APIs or SDKs provided by RenderEase.
  • These tools track user interactions such as views, rotations, zooms, and AR placements.
  • The collected data is integrated into your platform’s analytics dashboard, providing insights into user engagement, conversion rates, and product performance.
  • This data enhances your overall e-commerce strategy by enabling informed decision-making and improving customer experience.
  • Check the specific integration guides provided by your analytics tool for detailed instructions.
  • By analysing customer interaction data, you can identify pain points and areas for improvement in the user experience.
  • For instance, if a customer interacts with different features of the product configurator we can understand the level of engagement they have. 

Contact RenderEase For Inquiries

We’d love to hear from you! Whether you have questions, feedback, or need assistance, feel free to reach out to us.

Chat Icon

Contact Us